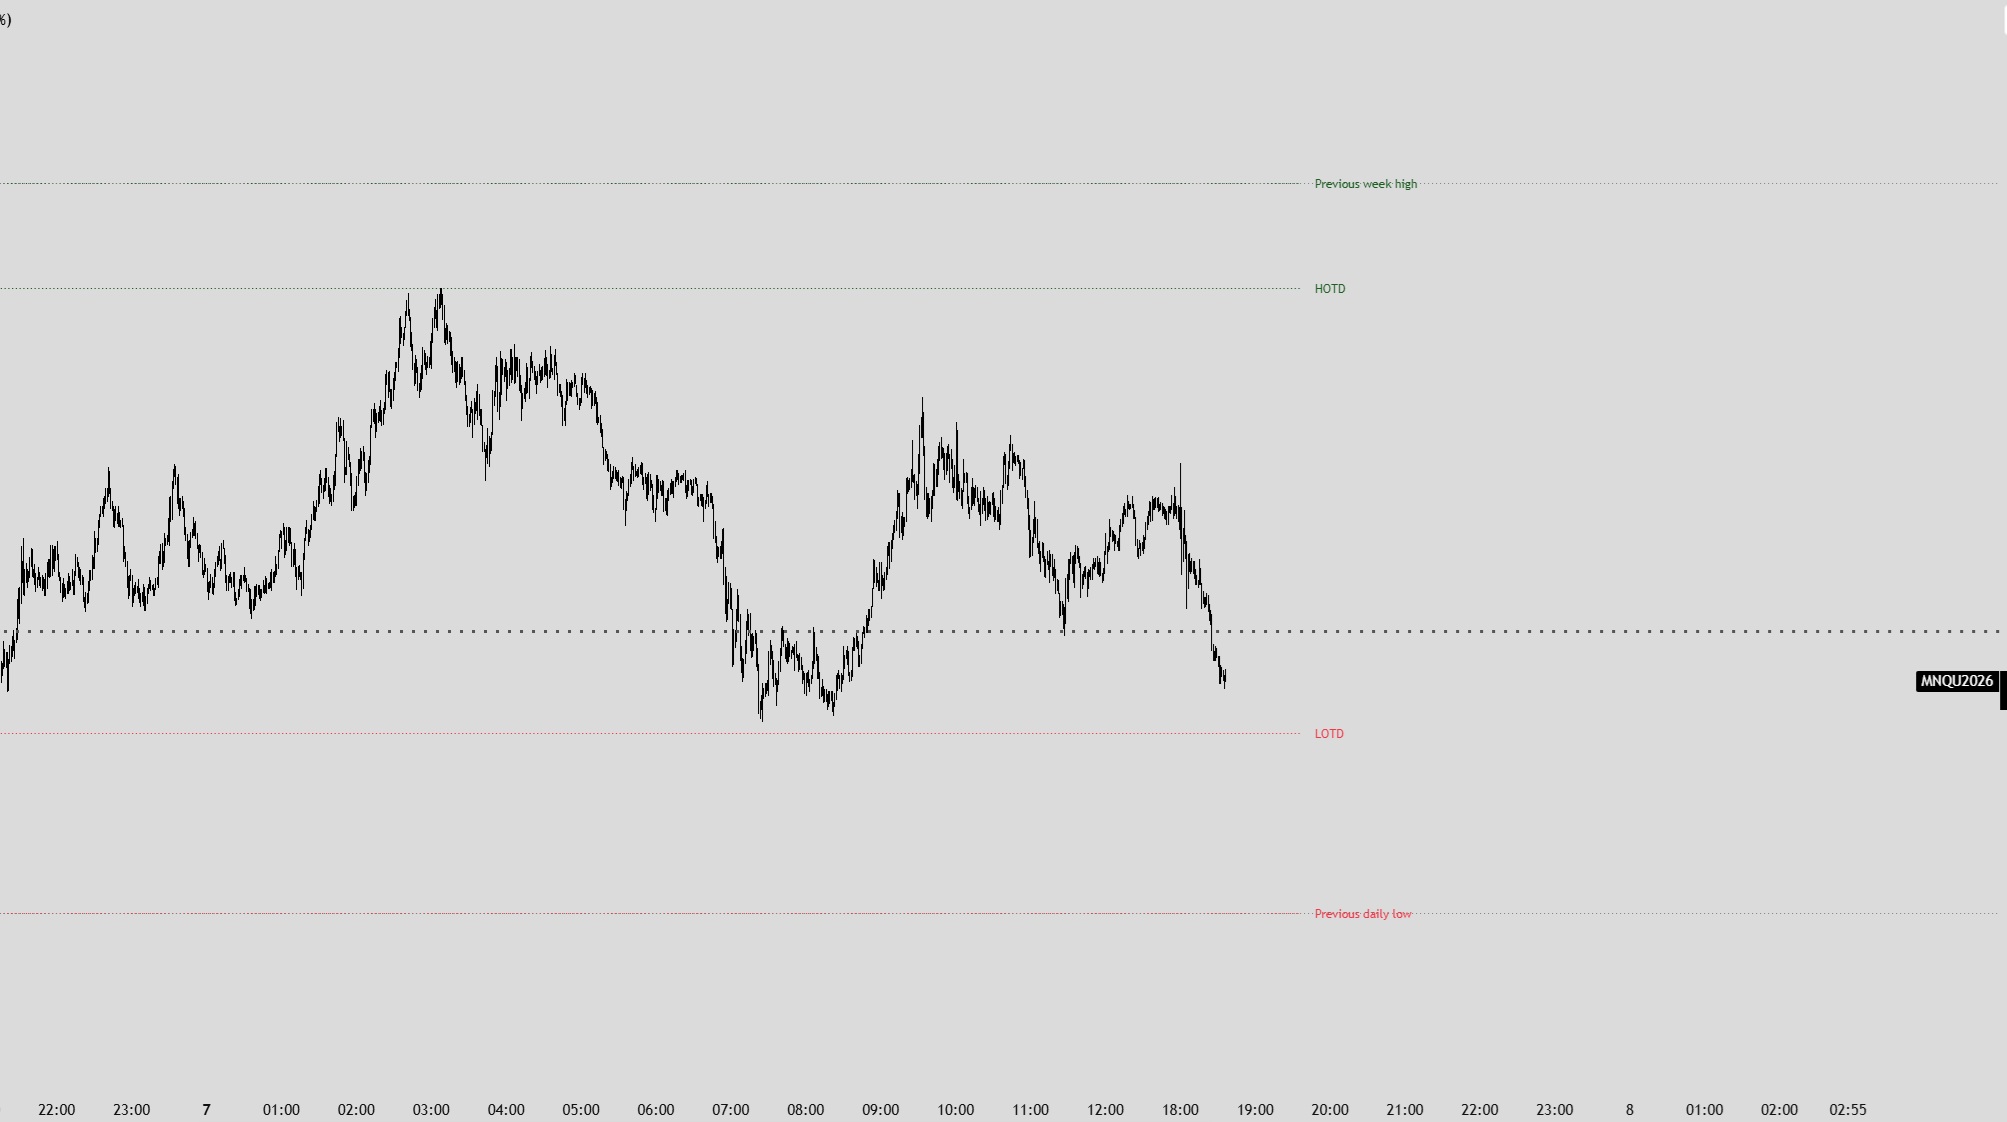
PDH_PDL
Draws the liquidity levels most intraday traders mark by hand every session: previous daily, weekly and monthly highs and lows, the all-time high, and the running high and low of the day.
Draws the liquidity levels most intraday traders mark by hand every session: previous daily, weekly and monthly highs and lows, the all-time high, and the running high and low of the day.
Two index futures have to agree before anything is drawn. This is a dual-asset model. You put the chart on the contract you intend to trade; a second index future is set in the settings as confirmation. A reversal that shows up on only one of them is not a setup here. Both have to shift, both have to leave behind the structure that supports the move — otherwise nothing appears on your chart.
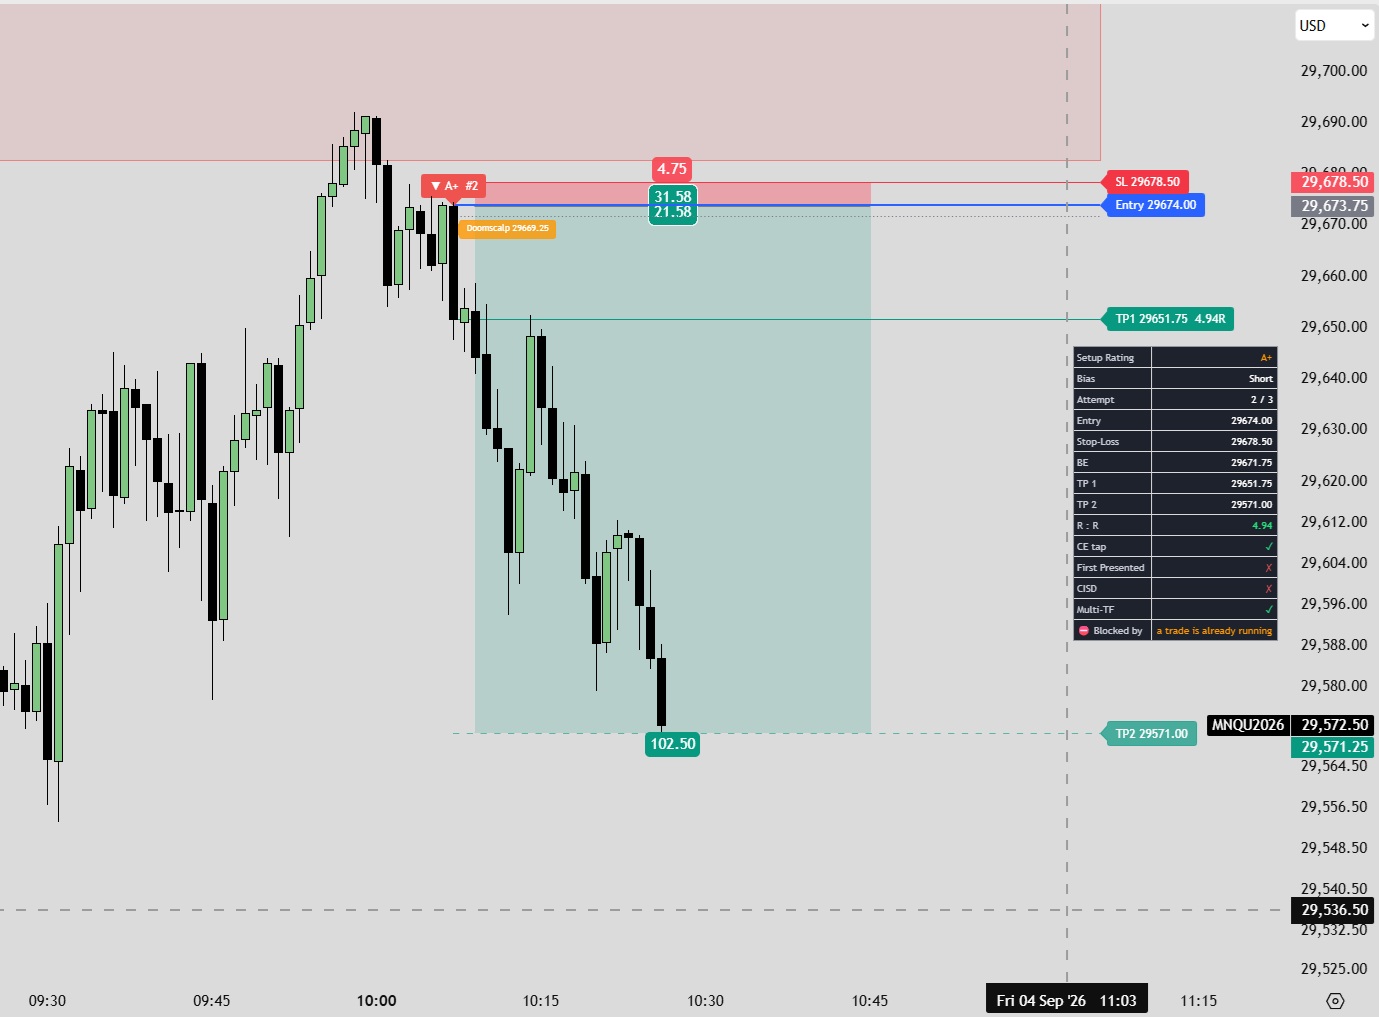
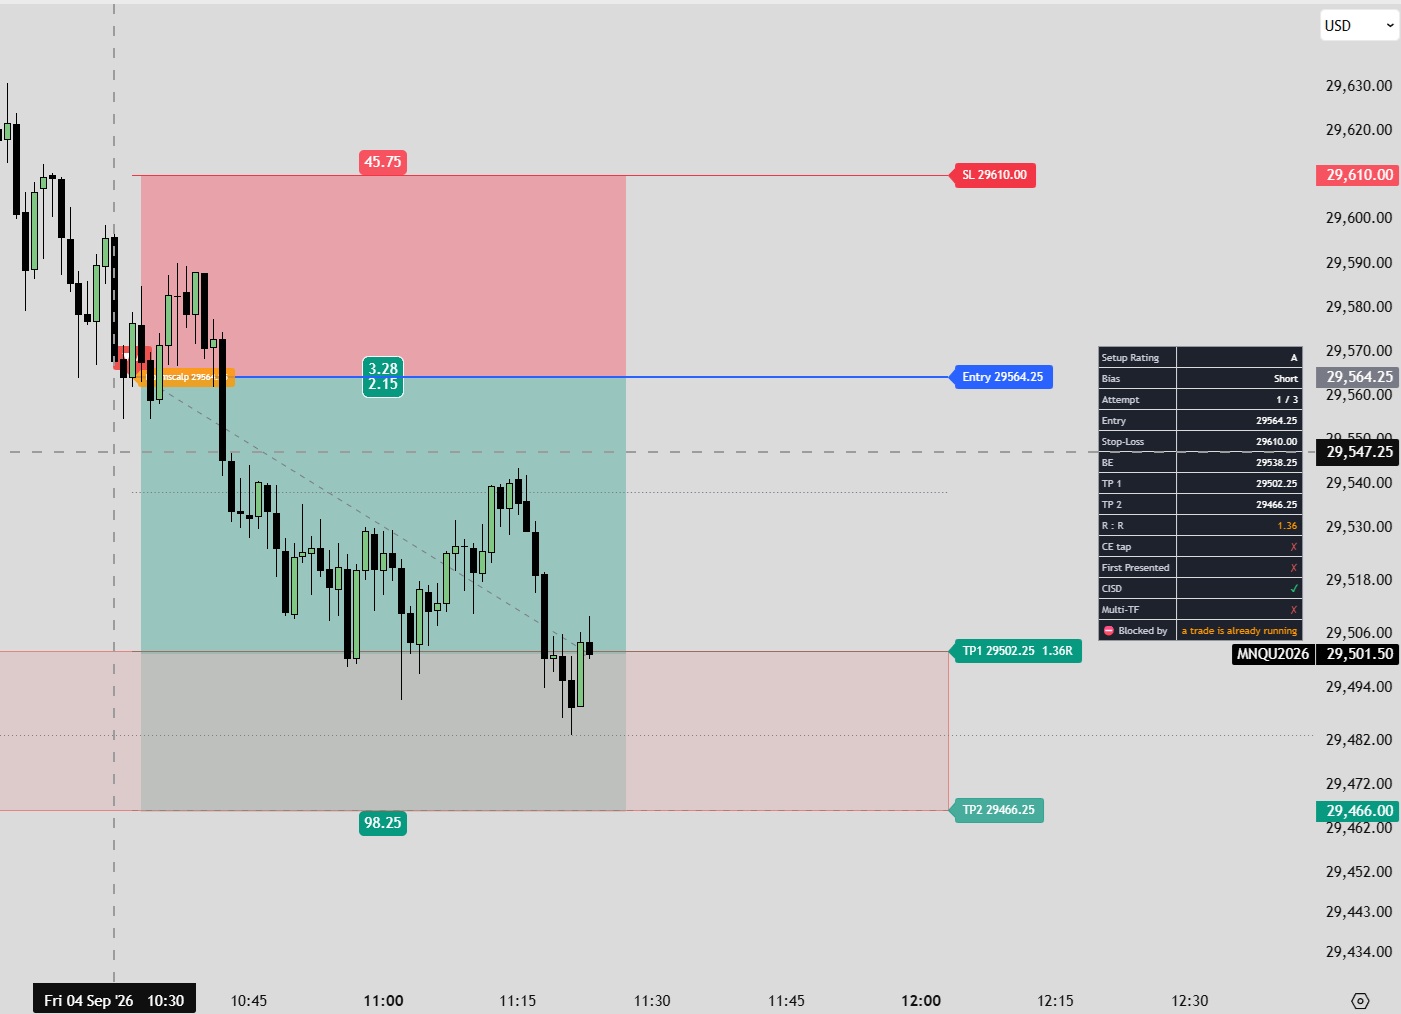
The same setup on every chart timeframe. Switch from the 1-minute to the 15-minute and the picture does not change.
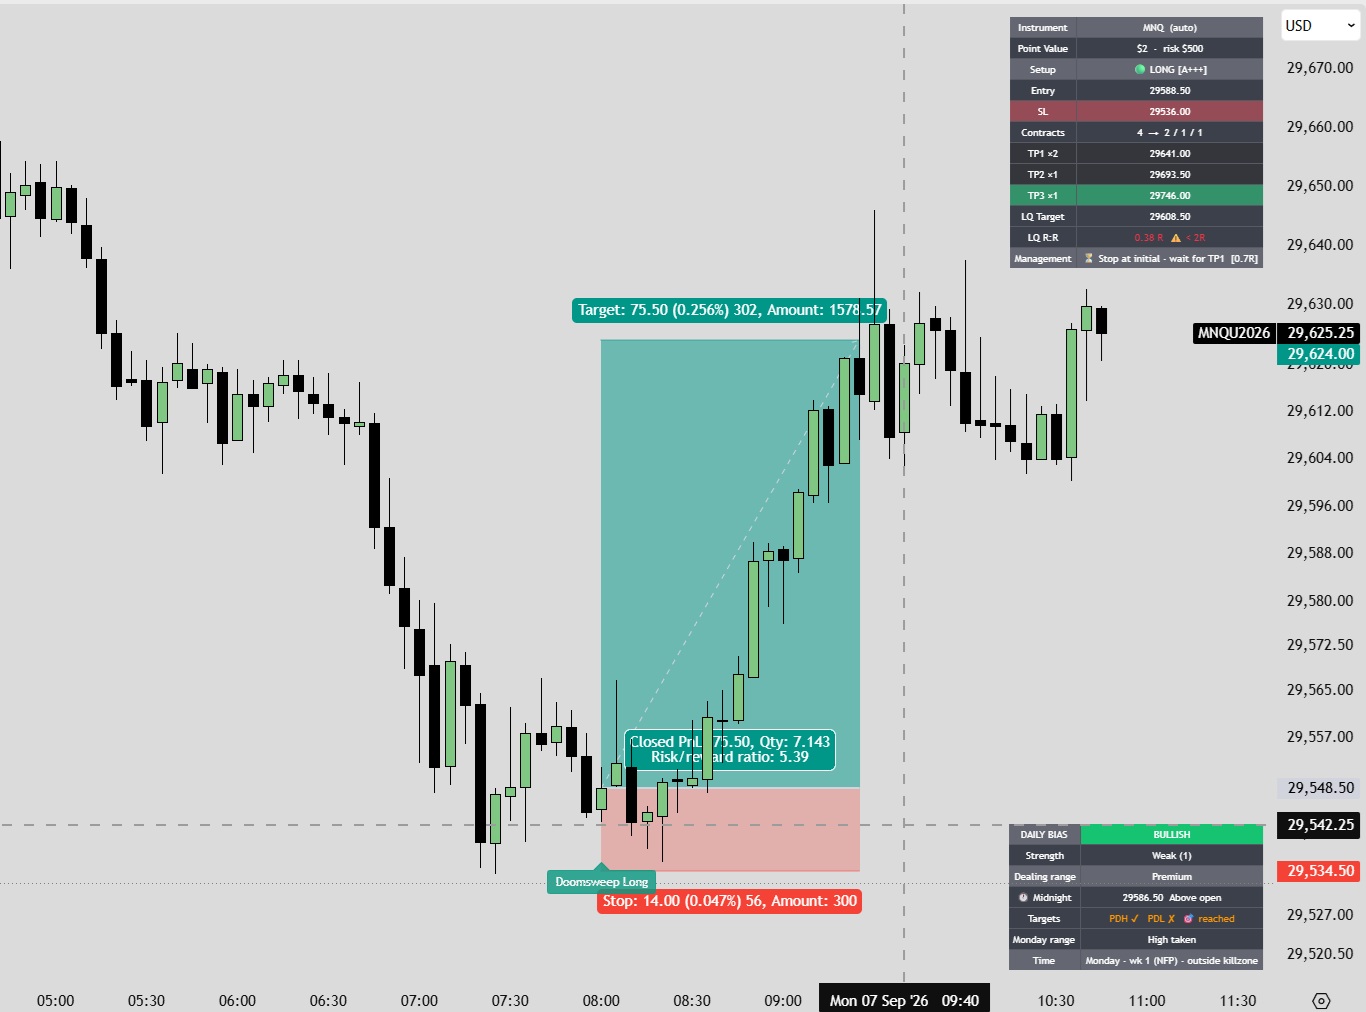
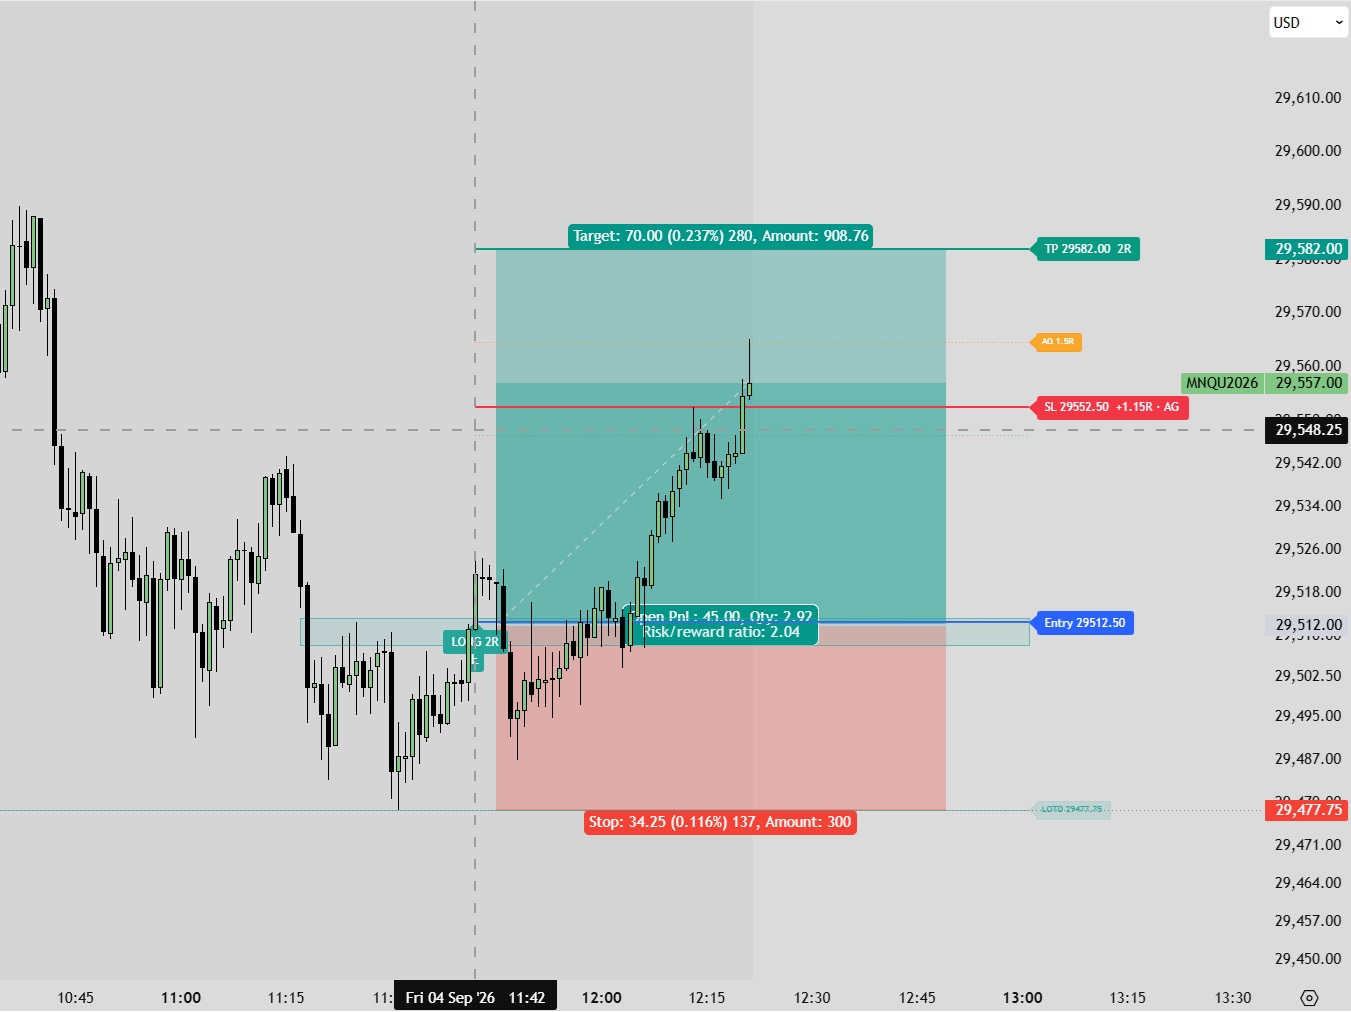
The whole trade, calculated before you take it. Not a marker on a chart: entry, stop, how many contracts your risk actually allows, how those contracts split across three targets, and where the stop moves.
Discord, live signals and educational content — all through Whop.
 Get Access on Whop